The View tab of wfview, also often called the “Main” tab, contains commonly-used controls for the radio and visualization.
Scroll down for a description of each element.
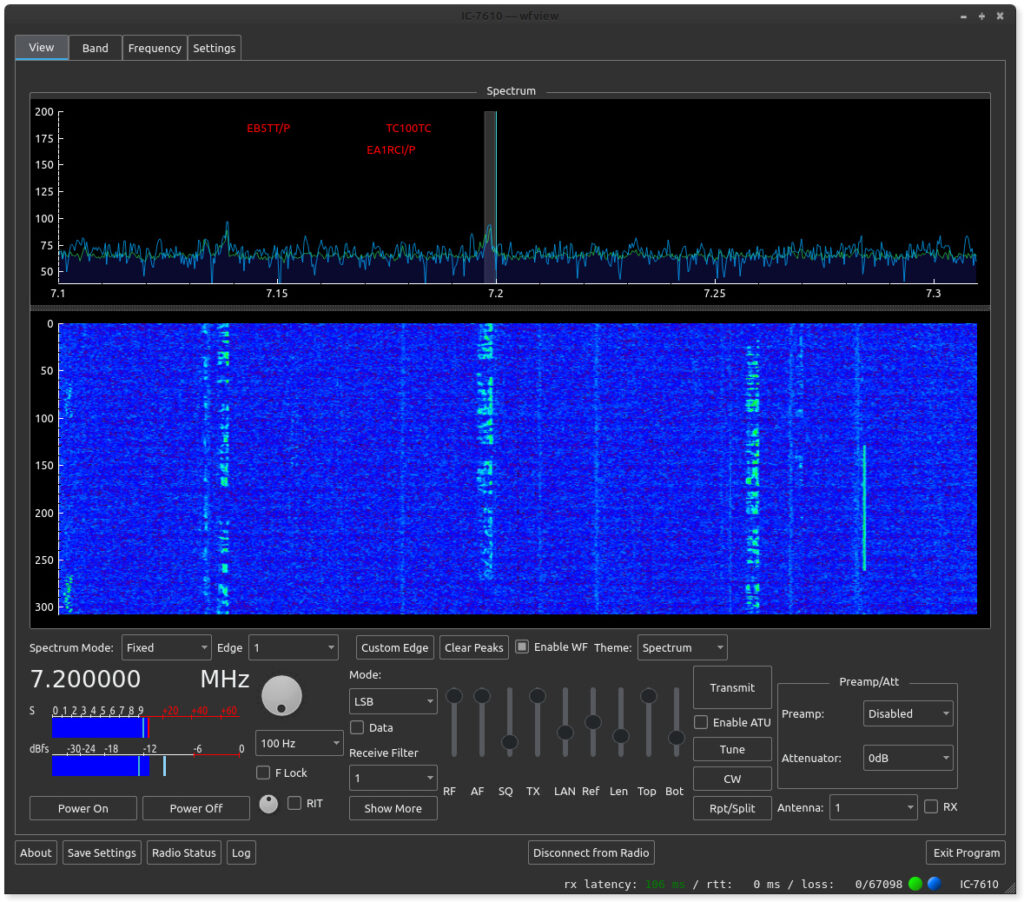
Spectrum plot and waterfall display:
These two items show the spectrum data passed from the radio to wfview. The vertical axis of the upper plot is likely proportionate to a value in dB, although the exact scale conversion isn’t known. Left to right is frequency. The bottom plot’s vertical axis is time, with newer values going in at the top. Many adjustments for these plots are available, read on to learn more.
Double-click anywhere in the plot to immediately jump frequency. A single click will simply show the frequency in the lower-left status bar area. Use the scroll wheel to quickly jog around the band.
The vertical tuning line in the upper plot indicates the carrier point of the radio. This is the frequency the dial indicates as well. The tuning line color can be customized (and even disabled via a transparent color) under the Settings tab on the User Interface page.
There is a divider between the upper plot and the lower waterfall section. You can drag the divider up and down to change the division of area between the plot and the waterfall.
Spectrum Mode and Edge controls:
- Spectrum Mode: This control selects between the radio’s built-in four modes: Center, Fixed, Scroll-C, and Scroll-F.
- Span: This control sets the total span for the spectrum, and is only available in Center and Scroll-C modes.
- Edge: In Fixed and Scroll-F modes, this control selects the current edge (1 through 4).
- Custom Edge: This button lets you define the scope edges in Fixed mode (in Scroll-F mode, the edge you define is translated over to the current frequency). The Custom Edge dialog box makes it very easy to jump to a desired frequency range.
- ToFixed: This button will take the current center span range and convert it into a fixed range. It is a quick way to keep the same displayed range and allow for tuning without changing the range displayed.
- Clear Peaks: Clears the spectrum underlay, which can be either Peak Hold, Buffered Peak Hold, or Average (select the desired mode under Settings).
- Enable WF: This checkbox can be used to turn off the waterfall data. This has the effect of freezing the waterfall display (good for taking a screenshot) and also makes the overall level of CI-V traffic a lot lower.
- Theme: Selects the data to color mapping scheme. The color themes come from QCustomPlot’s built-in themes, and can be seen here. Using the Top and Bot controls, the color scheme can be zoomed in around the data for very beautiful results.
Frequency and Tuning controls:
- Frequency: The current frequency is listed in large font (7.250 MHz). Tip: Press “*” (the star or asterisk key) to quickly jump to the Frequency tab and enter a new frequency).
- Knob: This is just a traditional tuning knob. You can use the scroll wheel of the mouse to turn it. Hold Shift or Control to increase the tuning step size.
- Tuning Step: This combo box (currently set at 100 Hz) sets the desired tuning step size. This tuning step is used for the tuning knob as well as scroll-wheel action over the spectrum and waterfall area.
- F Lock: This control locks the user interface tuning controls. It does not activate the radio’s tuning lock function, and will not stop external programs from tuning. Use this control if you want to prevent accidentally clicking or tuning around the spectrum
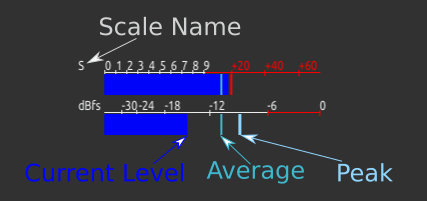
Meters:
wfview can display two meters at a time. The first meter is always power output during transmit, and receive strength (“S”) during receive. The second meter can be selected under the User Interface area of the Settings tab. Meters include: SWR, ALC, Compression, Voltage, Current, Center (IC-R8600 only), TxRxAudio, RxAudio, and TxAudio. Please keep in mind that the audio meters will only function for the client side of network radios. The audio meters do not do anything with a locally-connected USB radio.
The meter displays three numbers at a time.
- Instantaneous Level: This is the long solid bar which shows you the same value as the radio’s meter.
- Average: A thinner bright bar showing the average of the last ten or so readings.
- Peak: A thicker bright bar showing the maximum of the last ten or so readings.
The Meter Polling time can be adjusted under the User Interface page of the Settings tab. Shorter polling periods produce more responsive meters, but possibly at the expense of available CI-V bandwidth. wfview calculates a “safe” polling value on startup based on the type of radio connection, but faster values can be used if other programs are not polling as well.
Meter colors can be customized under the User Interface page of the Settings tab.
Power Controls:
On radios supporting this feature, the radio power may be turned on and off. Supported radios usually maintain some standby power which allows the radio to be remotely turned back on. For these radios, wfview may appear unresponsive on initial connection if the radio is off; pressing Power On will alleviate this condition. wfview will pause all communication to the radio for about three seconds during power on.
Mode and Filter Controls:
The mode may be selected from the pop-down combo menu (LSB currently in this screenshot). Some common modes may be quickly selected using keystrokes. The “Data” checkbox sets the data mode on the radio, for example, USB-D. Not all modes have a data mode.
The Receive Filter combo box allows for one of the radio’s existing filter definitions to be selected.
Show More opens additional radio controls such as IF-Shift. Not all radios support these controls:
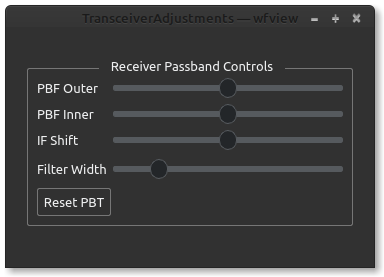
Use the PBF to shift the twin Pass Band Filter. The spectrum display will show the resulting adjustments to the PBF in red. Adjustments to the Filter Width will be in a lighter color. The IF Shift control can be used to simultaneously adjust both PBFs, simulating an IF Shift control.
Sliders:
The sliders in wfview are used as knobs for many common adjustments. The short names were chosen so as to allow the knobs to occupy less space in the interface. Each knob has useful “tooltip” text that can be seen by hovering the mouse over the slider for a few seconds. The numerical value of each slider is read out in the status text area (lower-left corner of wfview).
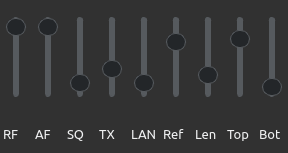
- RF: This is the receive RF Gain
- AF: This is the receive audio level. For network-connected radios, this is the volume of the streaming audio. For serial (USB)-connected radios, this controls the volume of the radio’s speaker. The level is saved when you save settings.
- SQ: Squelch. If you don’t hear anything on FM, try lowering this slider :-).
- TX: Transmit Power Level.
- MIC/LAN/USB/ACC/UNK: This next slider will have a name based on the currently-selected transmit mod (audio) source. For network radios, this will likely be set to LAN, and for serial radios being served onto a network using wfview’s built-in server, this will likely be set to “USB”, indicating the use of the USB port. MIC indicates the microphone jack, ACC is the accessory input, and “UNK” indicates an unknown setting, generally one of the “dual” settings that some radios support such as MIC/ACC. You can pick the radio mod source under Settings on the Radio Settings page. If you can’t transmit any audio, check here to see what the radio is set for, and adjust the level. It is a good strategy to verify audio by setting the meter to “TxAudio”. Once audio levels are verified, set the meter to ALC and adjust the LAN slider until you see appropriate ALC action. Some radios may have additional level controls available in the radio menu.
- Ref: This is the so-called Scope Reference Level. It is actually just a level control, but anyway, this lets you set the level of spectrum data.
- Len: This is the length of the waterfall display. Set to short values, you can see a lot of details, and set to long values, a longer history. This value can be changed any time; the waterfall data is always buffered for the last 1024 lines of spectrum.
- Top: This control adjusts the ceiling of the spectrum plot and the top value for the color mapping of the waterfall. Generally this should be set to match the maximum value on the plot. Set lower will accentuate the lower signals.
- Bot: This control adjusts the floor of the spectrum plot and the bottom value of the color mapping of the waterfall. Generally this should be set to just a little bit below the noise floor, although higher values will create a higher contrast display of strong signals.
Transmit, Tuner, and Repeater Controls:
- Transmit: Causes the radio to transmit. Control-T and Control-R can also toggle this behavior. PTT lockout is available under Settings on the User Interface page, titled “Enable PTT Controls”. While transmitting, this control will say “Receive”
- Enable ATU: This checkbox enables the radio’s automatic antenna tuner. If the ATU fails to tuner, this will automatically uncheck.
- Tune: This button causes the ATU to tune. Tuning success (or failure) will be indicated in wfview’s status text area at the lower-left.
- CW: Opens the CW Sender. See here for more information on the CW Sender.
- Repeater: Opens the Repeater Access Controls dialog box, where the tone, tone squelch, DPL, and repeater split direction can be set. Tip: Use the scroll wheel on the PL tone squelch combo box to quickly cycle through tones and find the repeater’s output tone. See here for more information on split and repeater usage.
Preamp, Attenuator, and Antenna Controls:
- Preamp: Select from the radio’s available receive preamps
- Attenuator: Select from the radio’s available receive attenuators.
- Antenna: Select from the radio’s available antennas.
- RX: Select the receive-only antenna (if available)
Bottom-Row Buttons (available in every tab):
- About: Brings up the about box, which displays the current version, git commit revision, and built date.
- Save Settings: Saves the current settings. Settings are otherwise discarded on exit.
- Radio Status: Shows the current radio and course audio levels. Future version of wfview may allow for multiple radios!
- Log: Displays wfview’s internal message log. This is generally the same text as the logfile. If wfview is not behaving as expected, click here and view the log. Read more about this feature here.
- Connect/Cancel/Disconnect: This button will connect to the radio, disconnect from the radio, or cancel an existing radio connection attempt. Look here to see if you have connected to the radio.
Bottom-Row Text:
- Left side: Status text. Shows slider values during adjustment and other information
- rx latency: latency for receive audio.
- rtt: round-trip time for receive audio
- loss: lost packets / total packets. For example, 0/25332 indicates that zero packets have been lost out of 25332 sent.
- Color “LEDs”: Green/Red LED indicates transmit and receive. I honestly forgot what the blue one means.
- NONE or Radio name: This text begins as “NONE” and changes to indicate the radio model number, for example “IC-718”. If you see “NONE” here, then your radio model is not being identified, possibly indicating a CI-V issue such as CI-V Transceive being off (it needs to be on) or other problems.